
cluster-smi: CLI tool for monitoring Raspberry Pi clusters
Published:
When you run a rack full of Raspberry Pis, the question that comes up constantly is not “which process is on which CPU,” but something simpler:
How is my cluster’s hardware doing right now?
Which nodes are hot or throttling? Which one is undervolted? Is a machine using far more memory or network than its peers? Did something reboot, fill its disk, or drop offline?
cluster-smi is a small terminal tool built for exactly that. Think of it as nvidia-smi, but for a fleet of Pis: one glance, one table, no agents, no dashboards, no database.
Why another monitoring tool?
Most “cluster monitoring” stacks assume you want history, alerts, and graphs. That is valuable—and also heavy. Standing up Prometheus, Grafana, and exporters just to answer “is node 3 cooking itself?” is overkill for many lab and edge clusters.
Administrators already live in SSH. They already know their hosts. What they often lack is a fast, hardware-centric snapshot that treats the cluster as a set of peers and highlights the odd one out.
cluster-smi deliberately stays out of the process-viewer and observability-platform business. No process list. No time series. No web UI. It SSHs to each node, reads kernel interfaces (/proc, /sys), and prints a compact table you can skim—or wrap in watch.
What you get
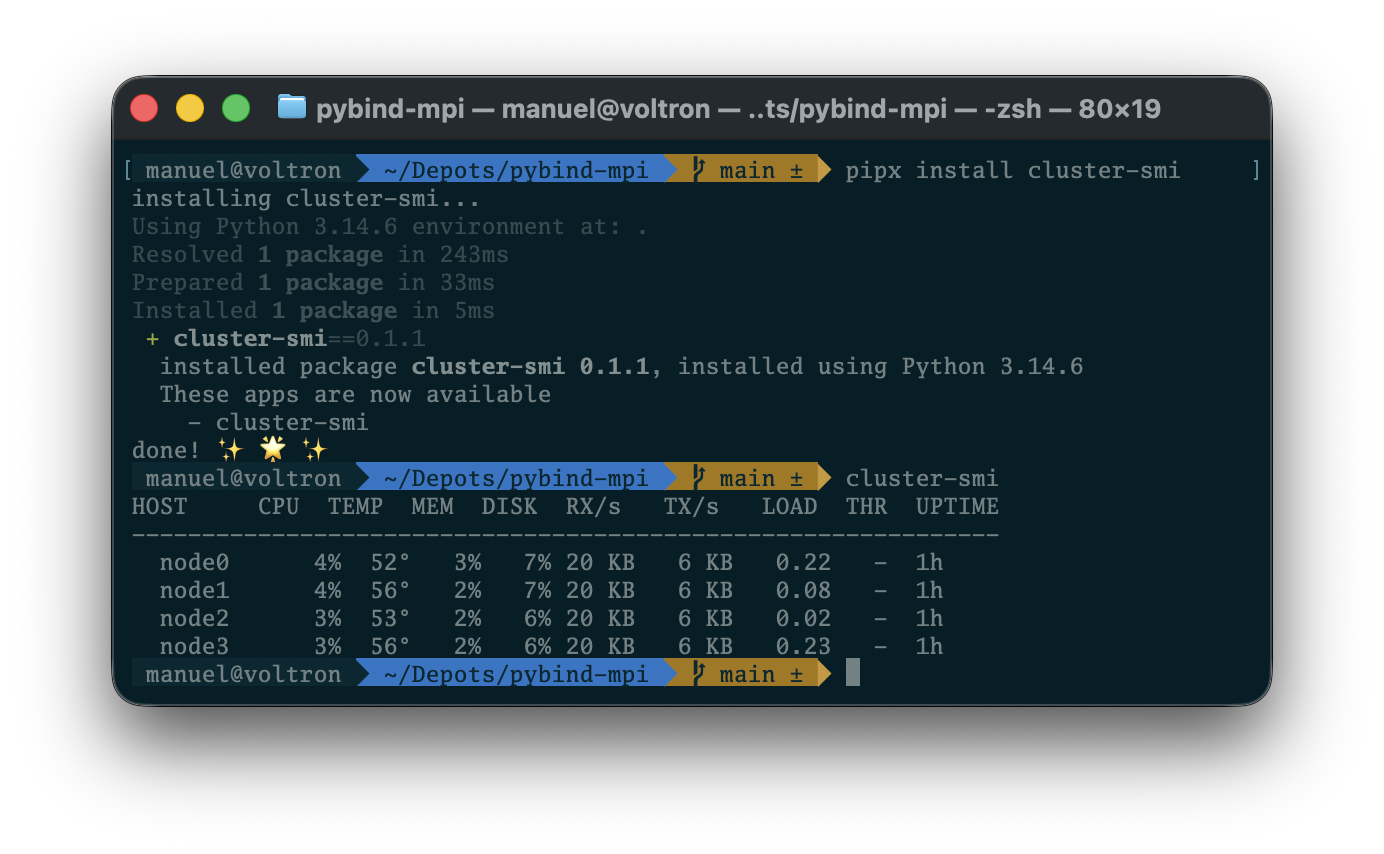
A single command produces a cluster table:
cluster-smi -h hosts.txt
HOST     CPU  TEMP  MEM  DISK  RX/s   TX/s   LOAD  THR  UPTIME
----------------------------------------------------------------
  pi01    21%  49°  31%  42%  3 MB   1 MB   0.41   -   4d
* pi02    98%  72°  81%  68% 41 MB   9 MB   5.02   T  11h
  pi03     3%  41°  18%  23%  0 MB   0 MB   0.04   -  18d
  pi04 OFFLINE
Rows marked with * look anomalous versus the rest of the cluster (or hit hard limits). The THR column surfaces Raspberry Pi firmware throttle flags—useful when a node is thermal- or power-limited and you would otherwise only notice from mysterious slowdowns.
Need detail on one machine?
cluster-smi node pi02
You get model, uptime, CPU, frequency, temperature, memory, disk, network rates, load, and throttle/undervoltage status—still hardware-focused, still one screen.
Under the hood, each poll runs one remote command per host. Raw counters come back as JSON; CPU %, RX/s, TX/s, and outlier detection are computed on your laptop so peers stay comparable without installing anything on the nodes.
Install
Requirements: Python 3.10+ and OpenSSH (ssh).
From Homebrew’s pipx:
brew install pipx
pipx install cluster-smi
From PyPI:
pip install cluster-smi
Or from the repository with uv:
cd /path/to/cluster-smi
uv tool install .
Ensure ~/.local/bin is on your PATH if you use the uv tool install. Editable installs (uv tool install --editable .) are handy while developing.
Try it without a cluster:
cluster-smi --mock
Quick start for administrators
- List your nodes in
~/.config/cluster/hosts.txt(SSH Host aliases work):
mkdir -p ~/.config/cluster
cat > ~/.config/cluster/hosts.txt <<'EOF'
pi01
pi02
pi03
ubuntu@pi04
EOF
- Run:
cluster-smi
- Refresh live when you are watching a change:
watch -n 2 cluster-smi
Useful options include -h / --hosts for another file, --interval and -n for refresh behavior, and the usual SSH knobs (-u, -i, --port, --ssh-timeout).
Runs are non-interactive (BatchMode)—no passphrase prompt. Keys must already be available via the agent (on macOS, Keychain / UseKeychain matters; see more details in the project README
Why this matters for admins
Speed of answer. Open a terminal, get a peer-comparable view in seconds. That is the right latency for “something feels wrong on the rack.”
No footprint on the nodes. You do not deploy agents or exporters. If SSH works and the kernel exposes the usual interfaces, you are done. That fits air-gapped labs, classroom clusters, and fleets where you prefer not to widen the software surface.
Hardware signals that apps miss. Throttling, undervoltage, temperature, and peer outliers catch power and cooling problems that look like “the job is slow” from the application side.
Fits the Unix toolbox. Output is meant for humans and for watch / scripts. It composes with how you already operate instead of asking you to adopt a new platform.
Clear scope. When you need history and alerting, keep Prometheus. When you need a process tree, use htop or ps. When you need “is this Pi healthy relative to its siblings?”, use cluster-smi.
Closing
cluster-smi is for people who administer Raspberry Pi (and similar Linux) clusters and want a first-class answer to hardware health—without standing up monitoring infrastructure for every glance.
Install it, point it at a hosts file, and run it. Your next “which node is misbehaving?” moment should take one command, not a dashboard.
- Project: github.com/wme7/cluster-smi
- Install:
pip install cluster-smi
Cheers!